


Connected Operations & Performance Optimization
Merck is a global leader in science and technology, specializing in healthcare, life sciences, and electronics.
€1.4m
positive impact30%
downtime reduction€1M
annually on employee time300%
increase in safety incident reporting
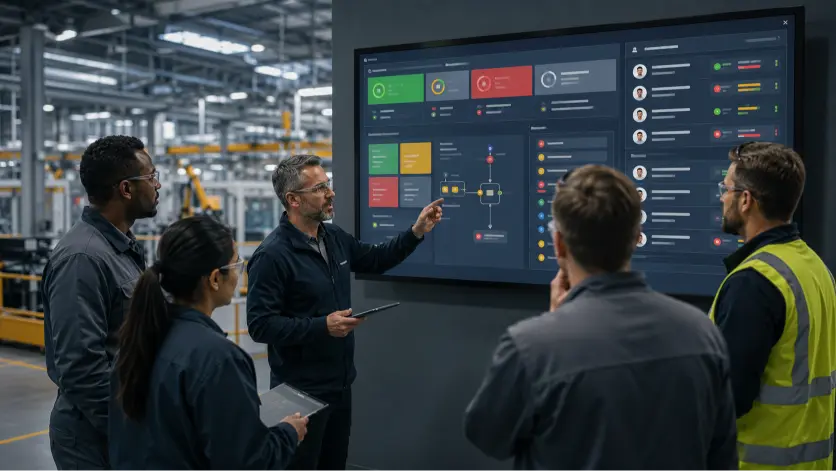
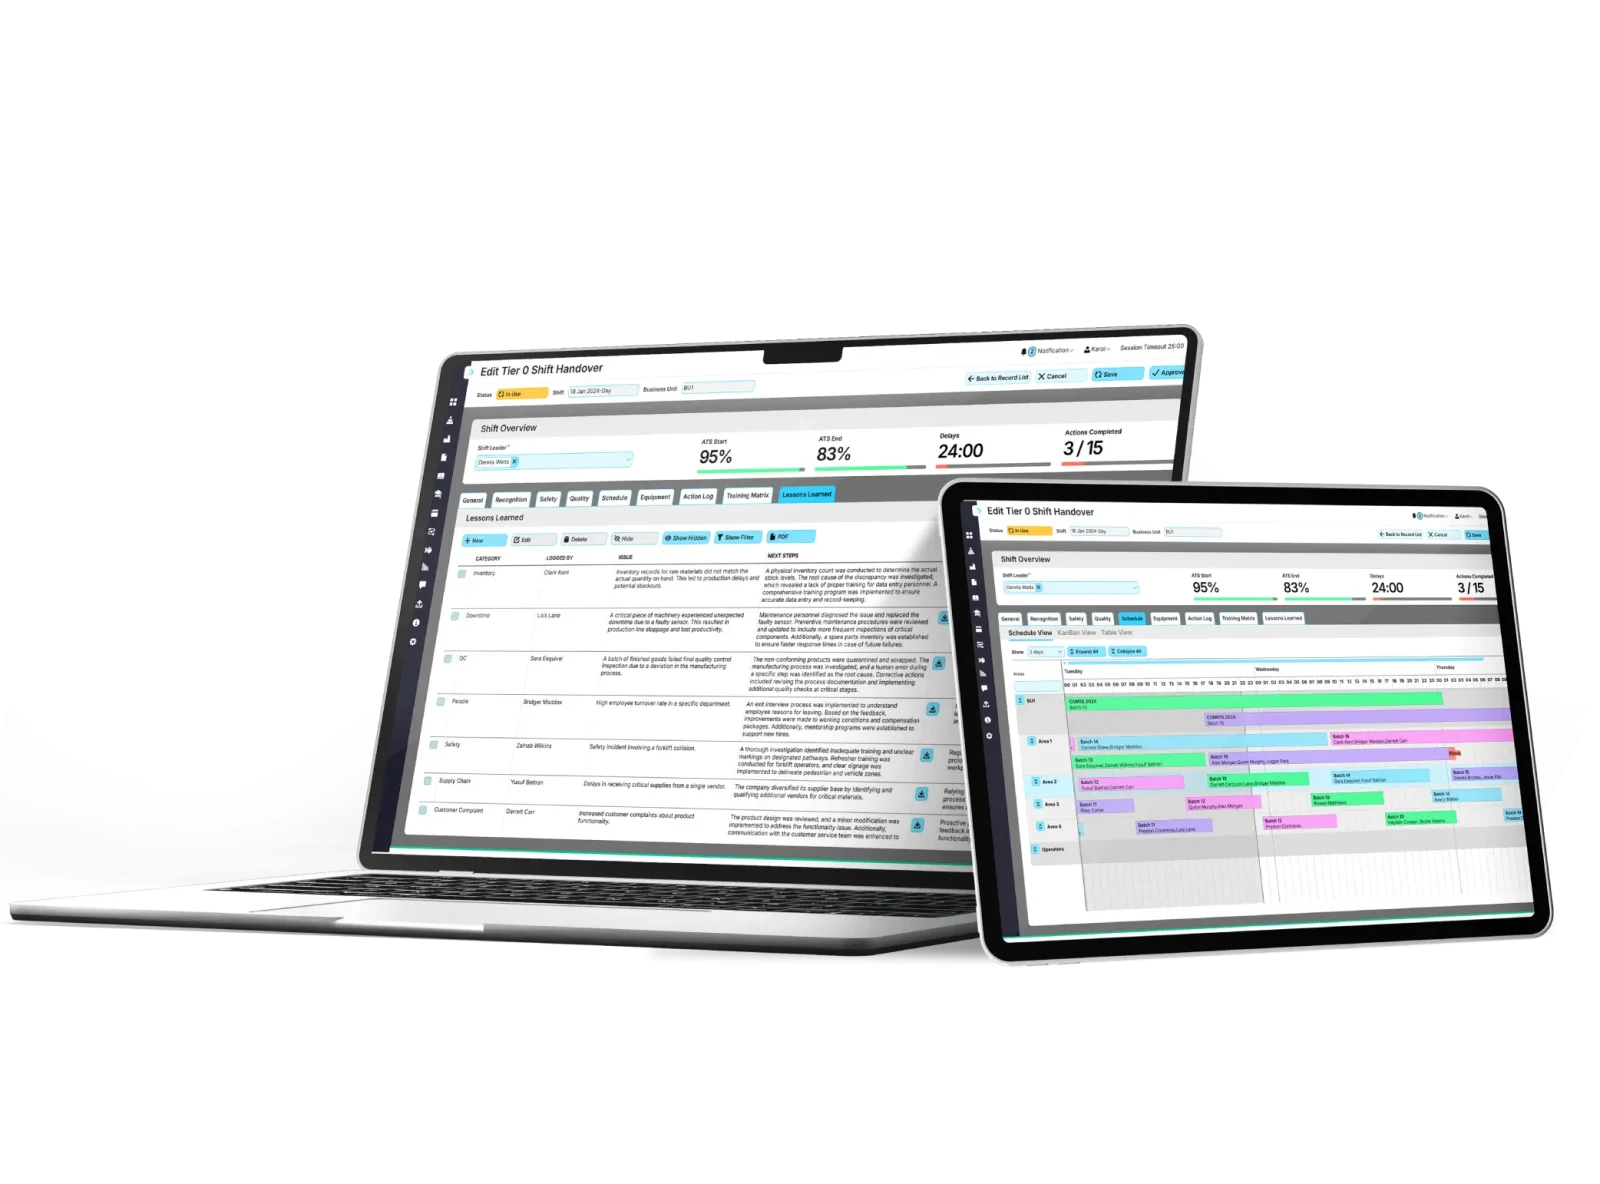
Integrated Shopfloor Management & Shift Excellence
Aurubis AG, a leading global provider of non-ferrous metals and one of the largest copper recyclers worldwide.
7,100
users across multiple sites100%
rollout across production areas100%
employee adoption for shift handovers
OEE Optimization & Real-Time Production Insights
Cara Partners is a bulk pharmaceutical manufacturer specializing in the production of a standardized extract of Ginkgo biloba.