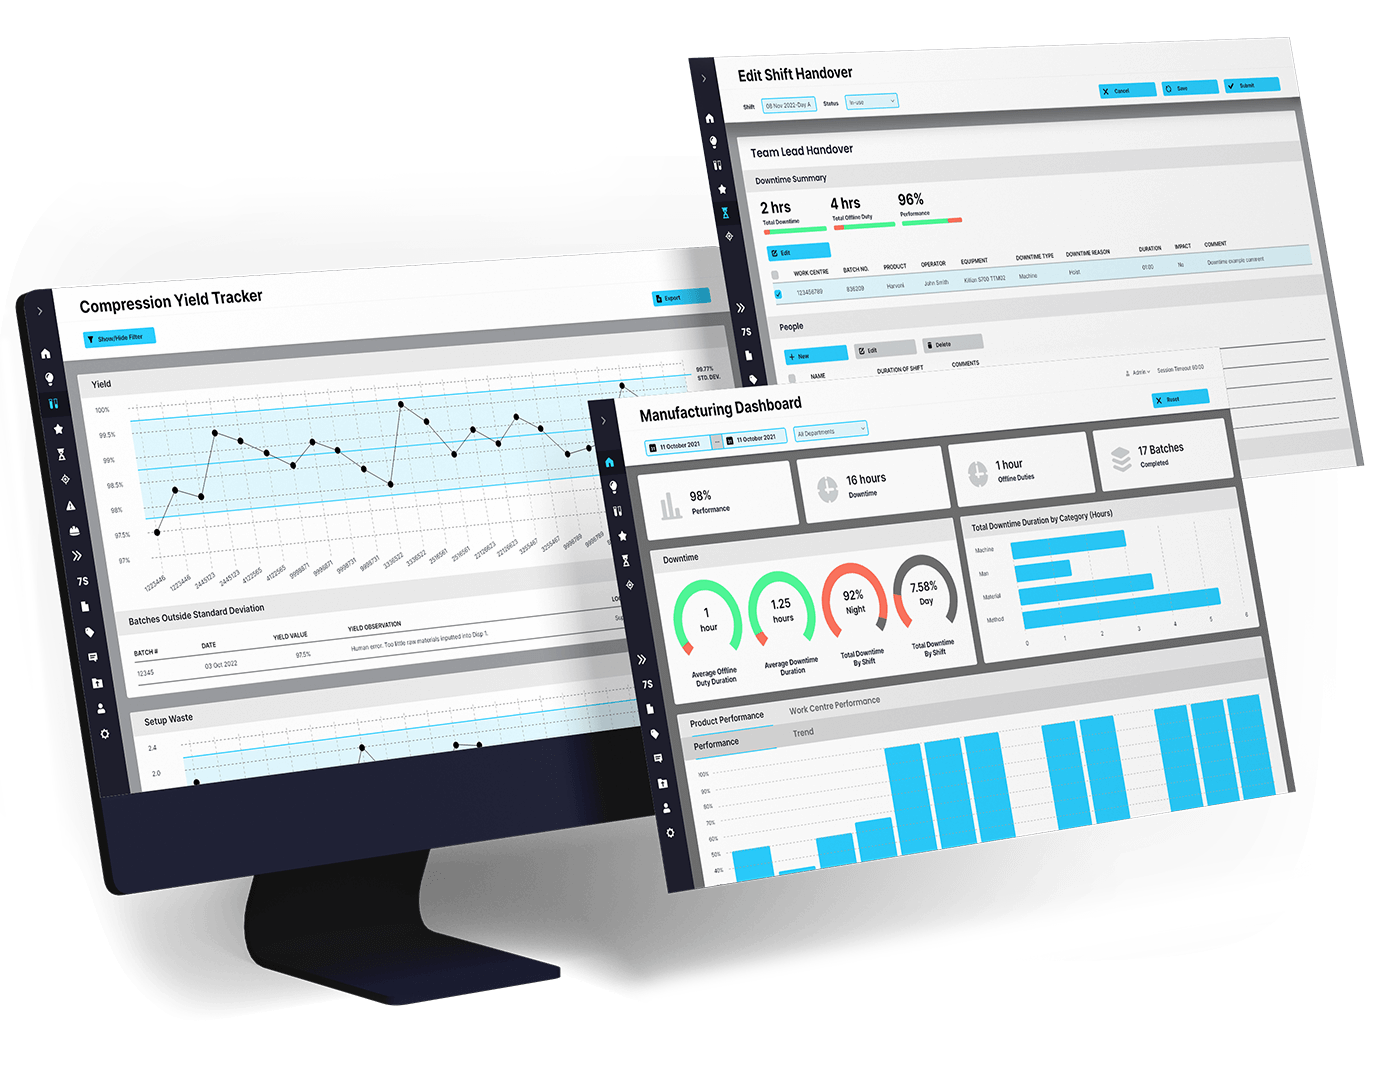
Up-to-date data is always available when and how you need it. EviView’s intuitive dashboards and reporting modules provide instant analytics, powered by workflows from the Digital Shift Handover module. These features ensure real-time insights, making EviView a trusted manufacturing analytics solution for operational excellence.
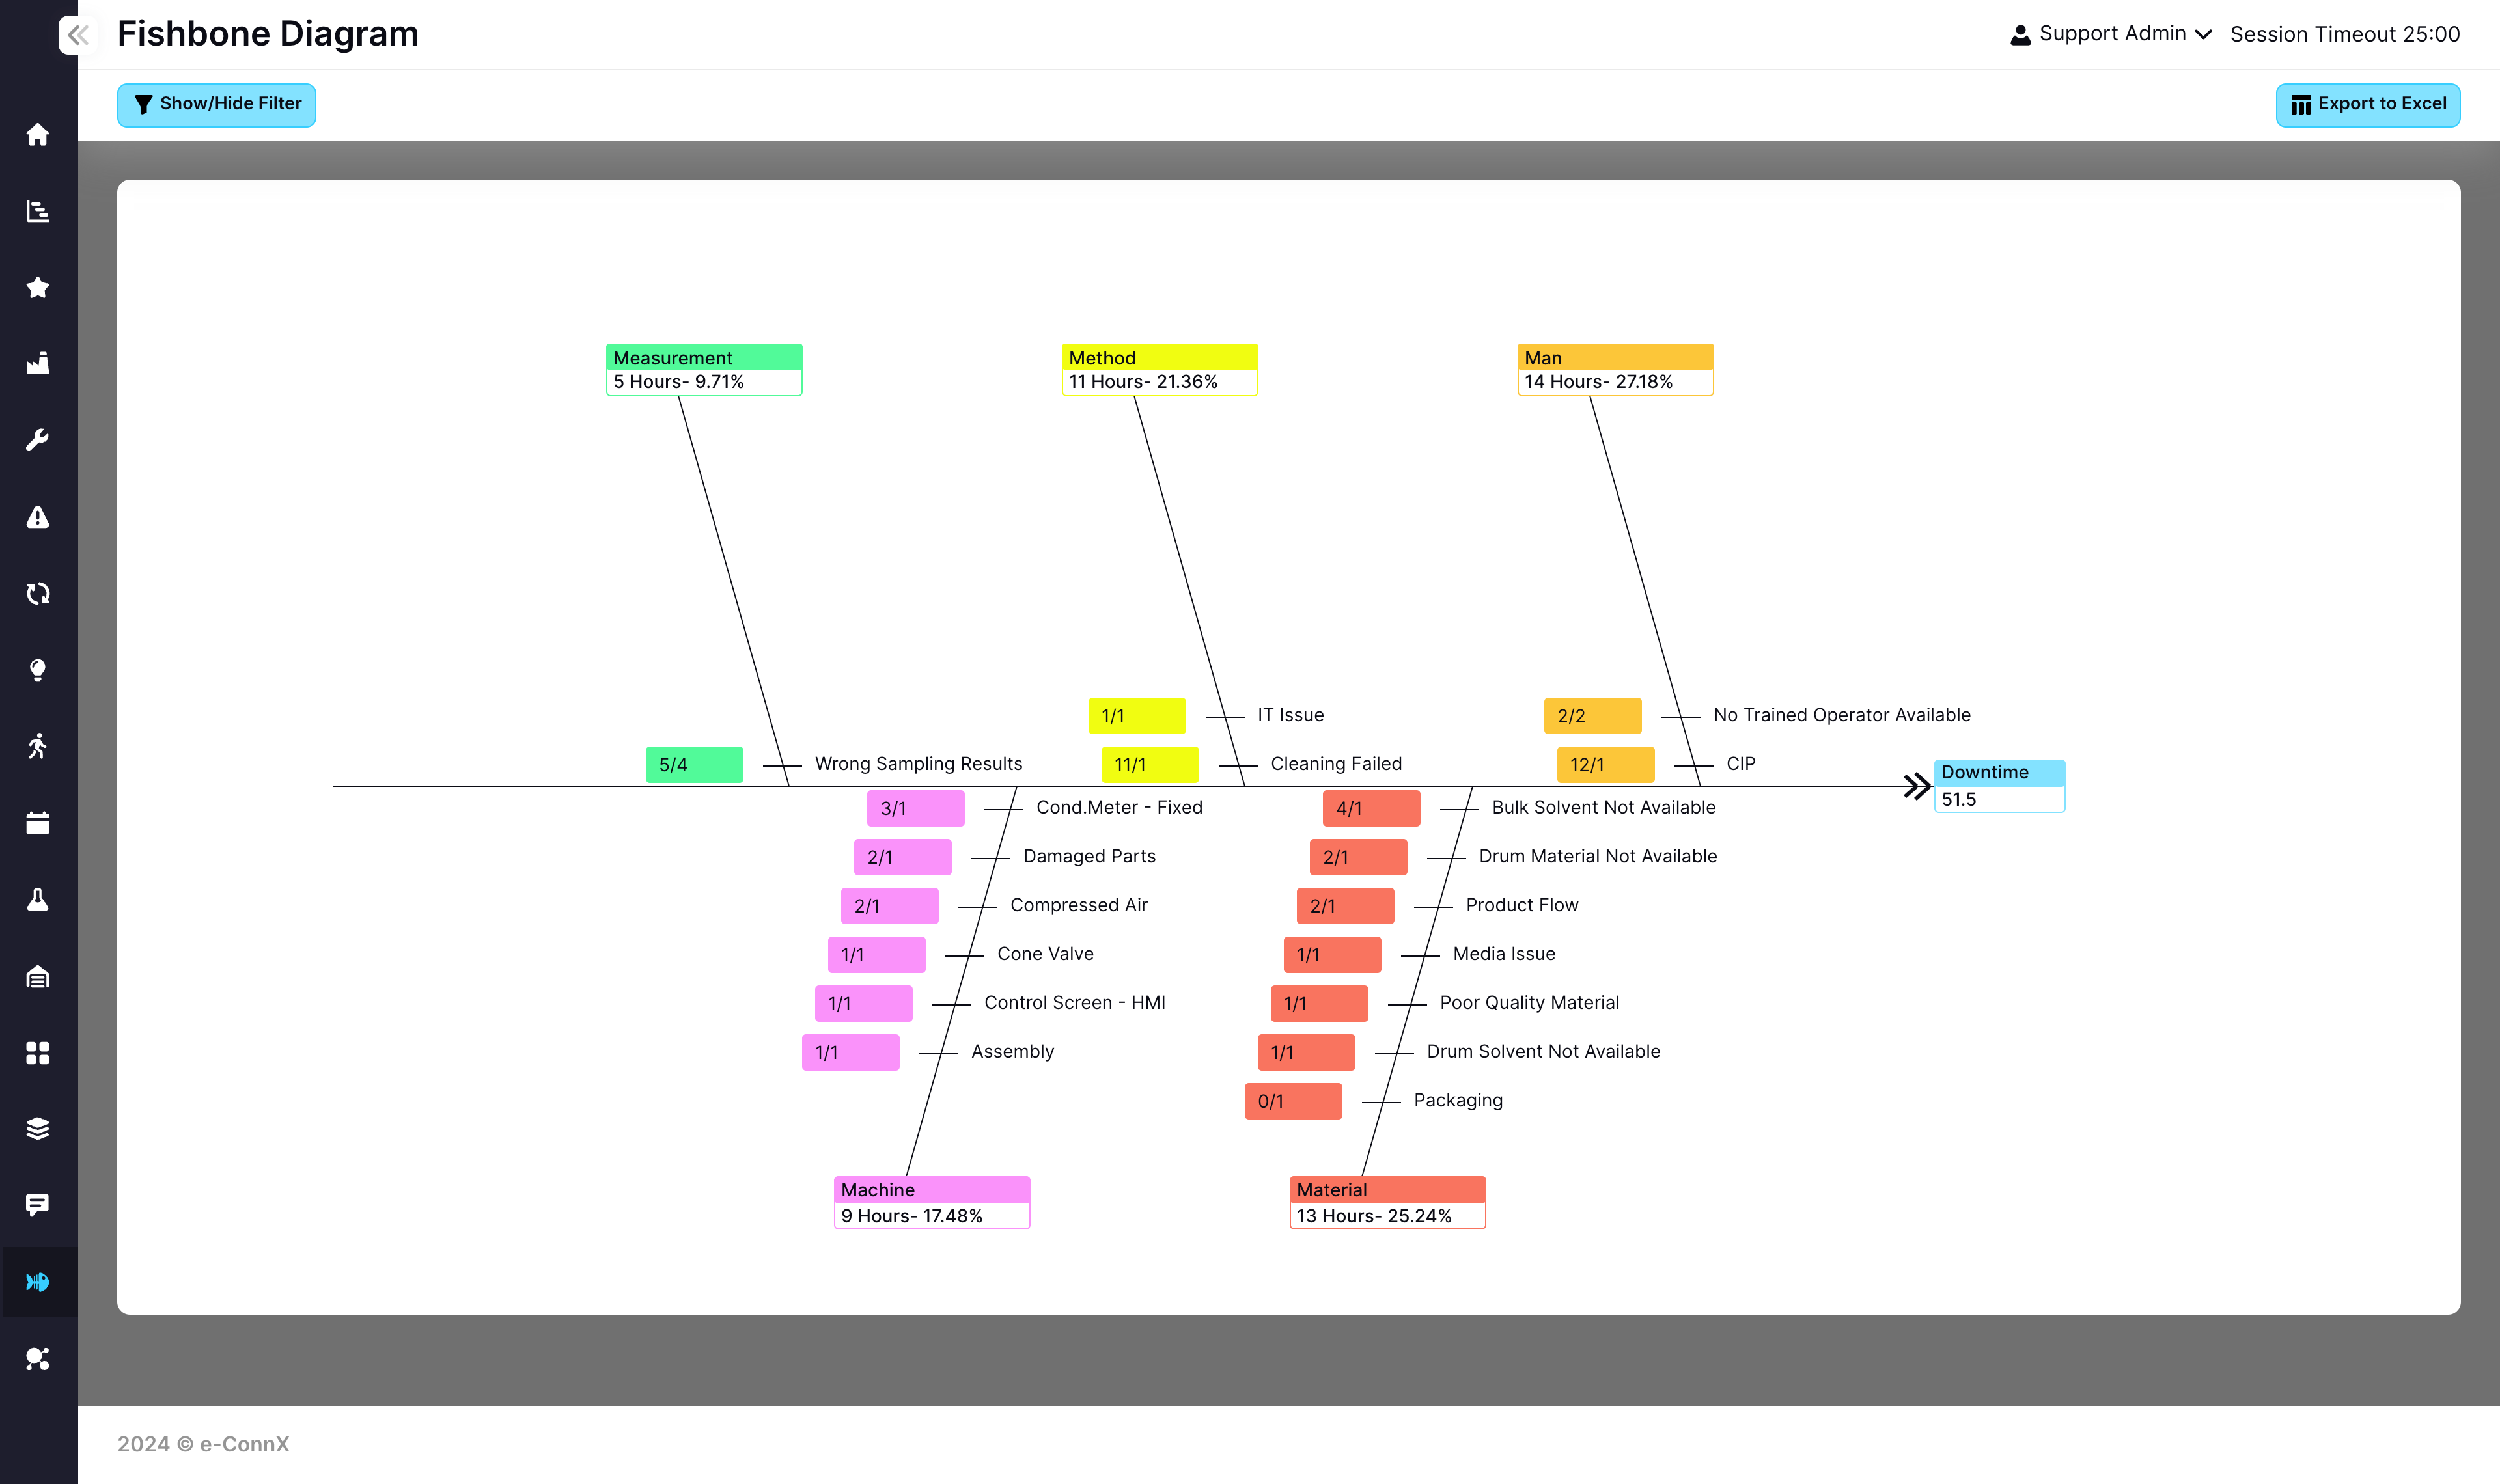
EviView’s manufacturing analytics adapts to your needs. Configure reports to fit your unique operations, personalise downtime reasons, or leverage tools like Fishbone and Pareto diagrams. Import and export data effortlessly while ensuring alignment with your manufacturing shift patterns.
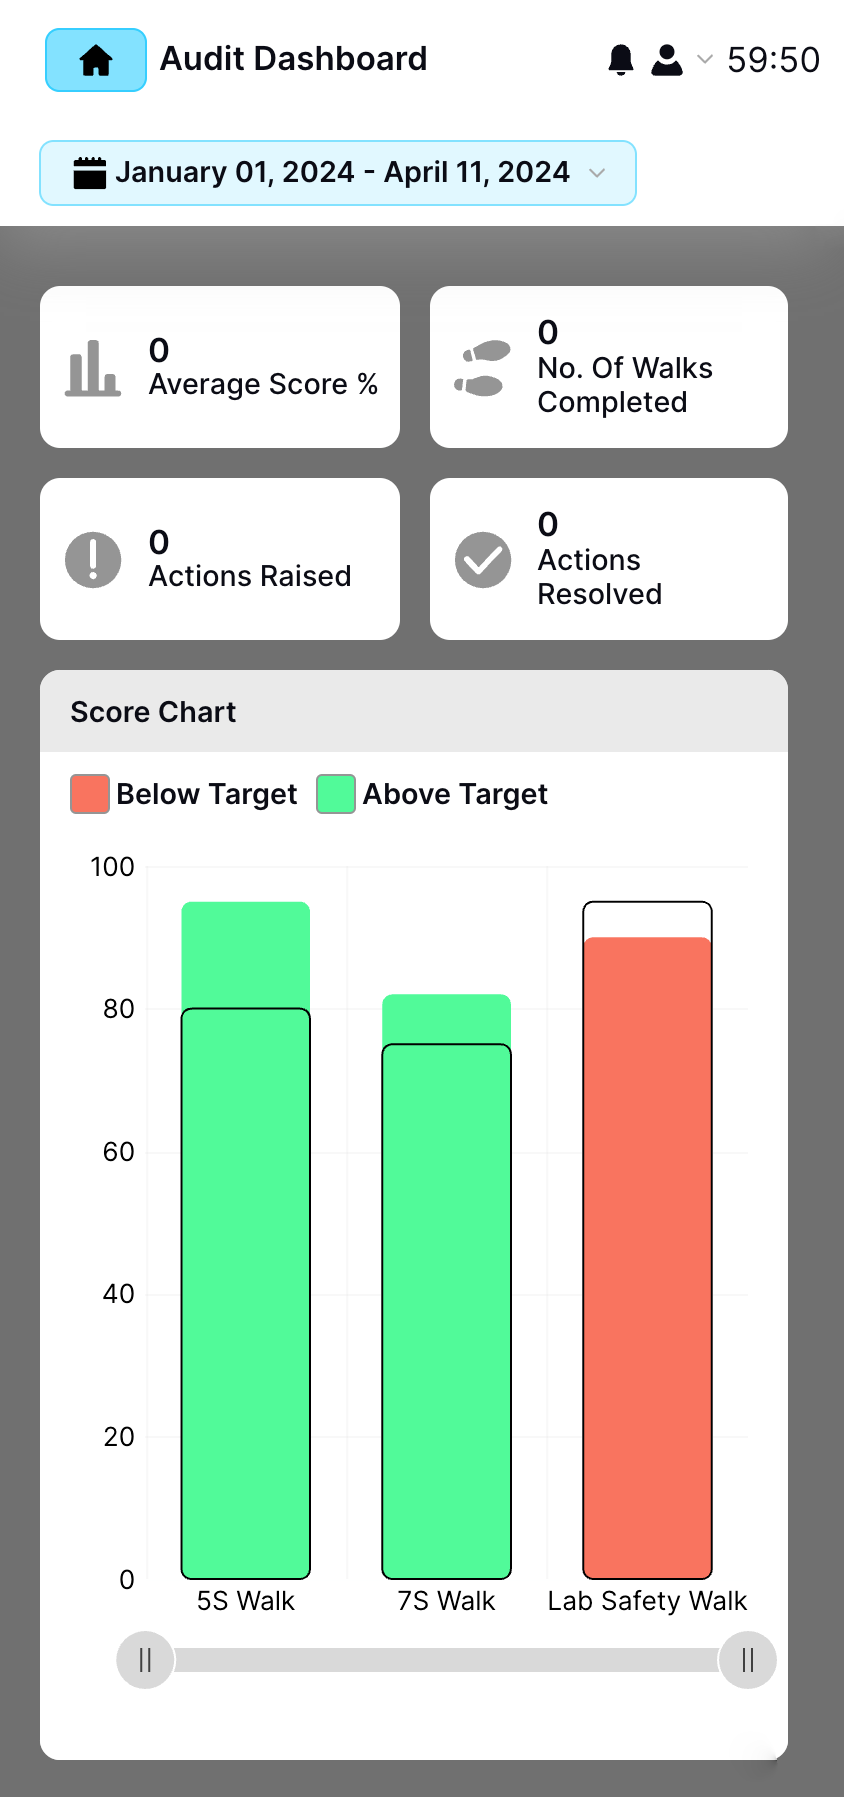
Instantly query data across various filters and time periods. Track every production cycle—pre, during, and post batch—with intuitive traffic light indicators. This downtime data seamlessly integrates into the Continuous Improvement modules for action tracking, ensuring greater visibility into your processes.
EviView promotes a data-driven culture by centralising access to production information. The platform bridges gaps between engineering, operations, and maintenance teams, encouraging collaboration and enabling faster problem-solving. With its manufacturing analytics solution, EviView empowers organisations to drive efficiency and improve overall production performance.

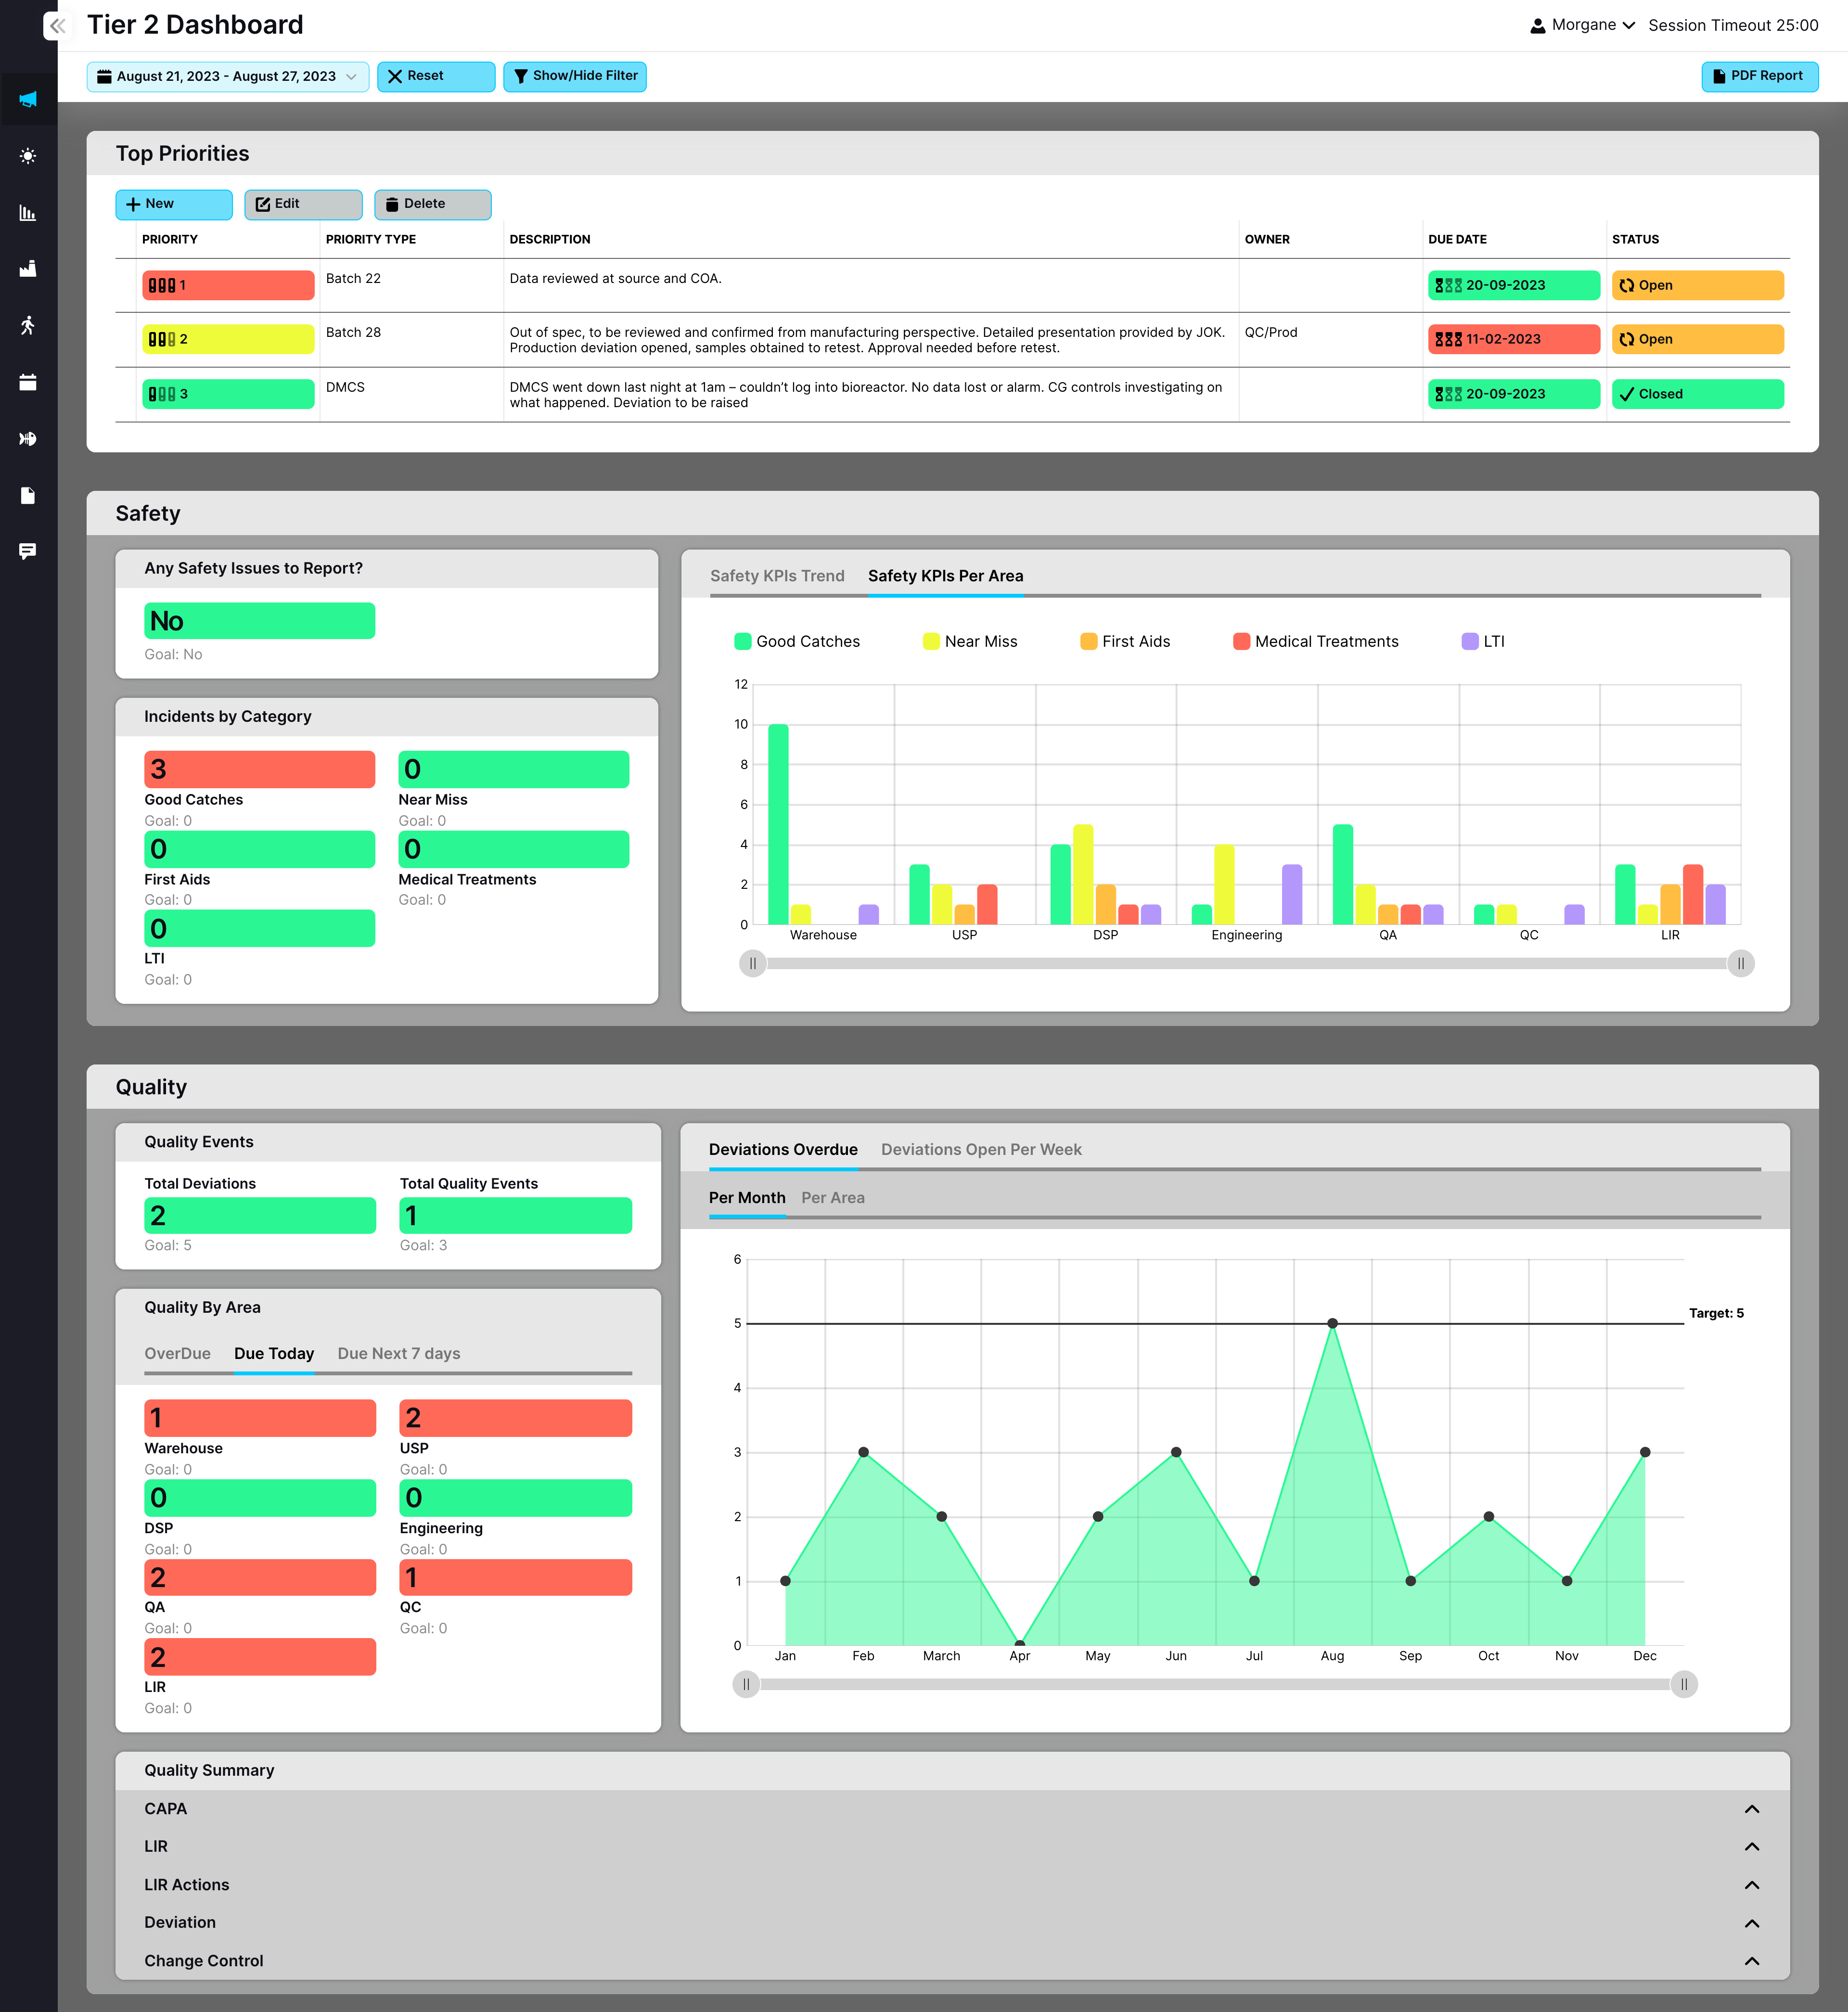
We believe that what gets measured gets managed. Management teams rely on accurate and instantly accessible data to make informed decisions. With EviView’s manufacturing analytics, you can take a high-level look at your KPIs or dive into granular details using the interactive dashboard.

EviView’s manufacturing analytics enables production and work centre processes to be mapped into units of standard work. This visual, time-sequence interface helps operators stay on schedule while simplifying reporting.

Post-batch release activities, such as quality checks, packaging, and shipping, can be easily charted and monitored to ensure a seamless operations flow. Similar to the pre-batch tracker, traffic lighting provides instant visualisation of what’s on track and what requires attention.
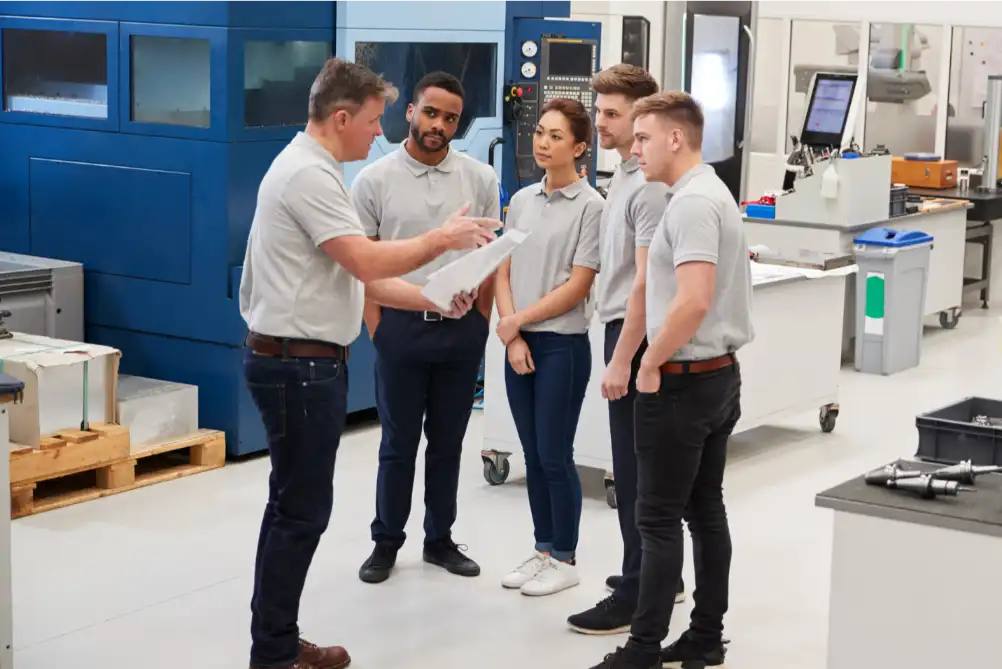
Turning real-time production data into clear insights that drive performance, solve problems, and support continuous improvement.


A member of our team would love to introduce you to our platform and answer any questions you may have.
How we can help: